This page lists some useful concepts for thinking about climate change, as well as references for further reading.
The climate system is global
To understand climate change, we need to zoom out – to the entire planet.
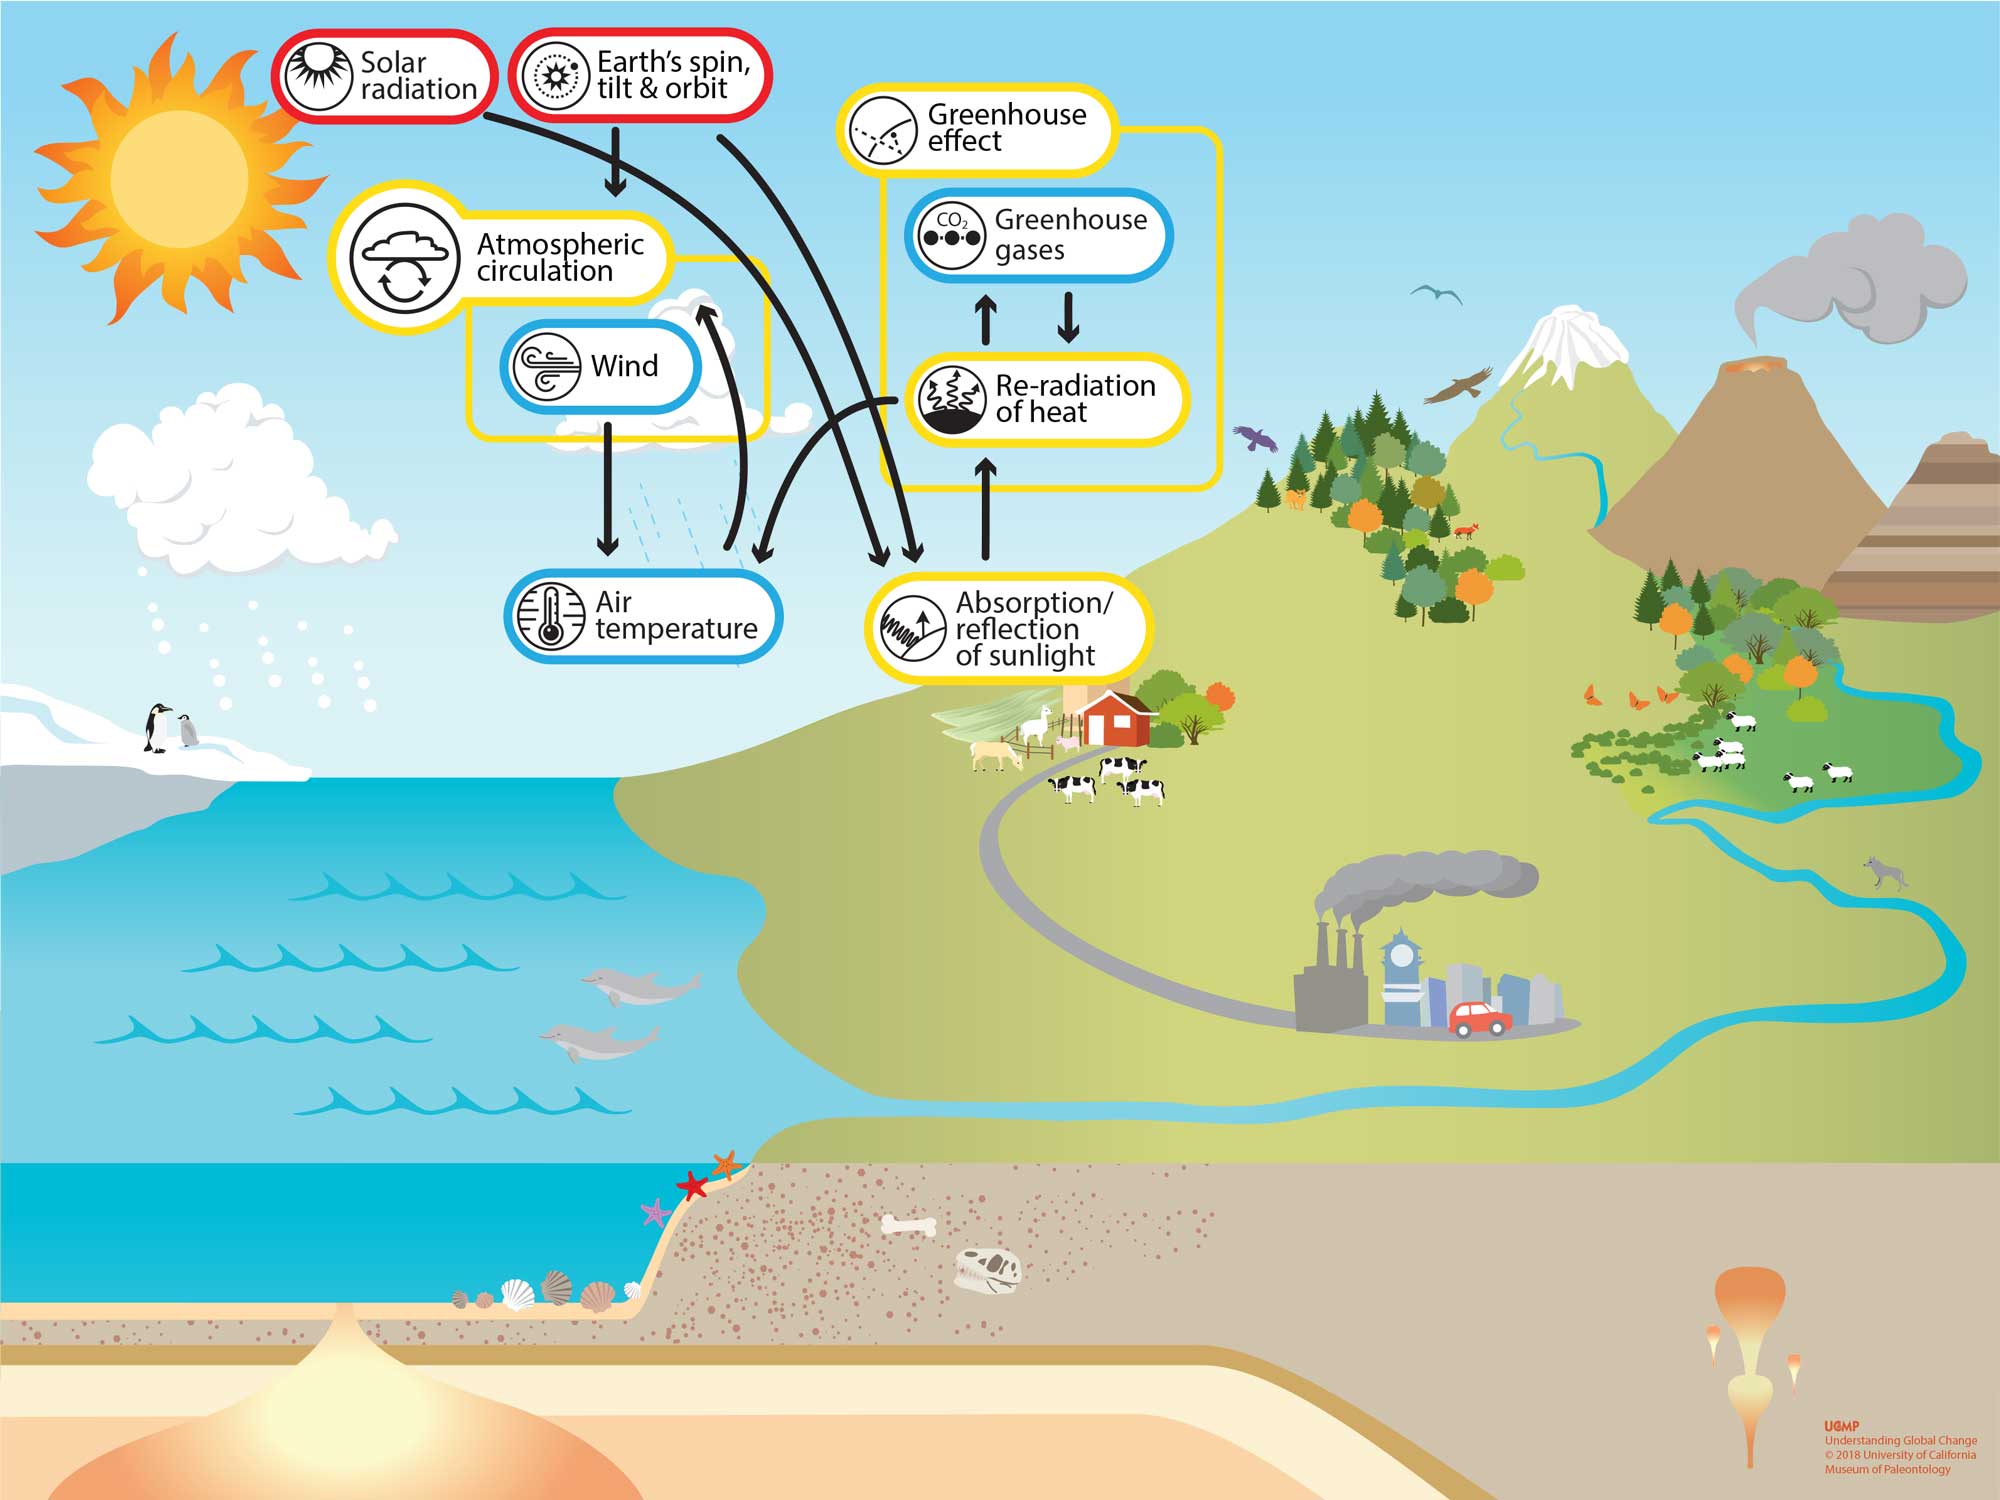
That’s because our climate system is global. Sunlight streams down to earth, providing a reliable source of energy. The concentration of incoming solar radiation is greatest at the equators and lowest at the poles (a little bit like how a well-rotated sausage gets less cooked at the ends because they never directly face the flames). Because of the earth’s axial tilt and our rotation around the sun, the amount of sunlight arriving at any given location depends on what time of year it is, which is why we have seasons. Water takes longer to warm up than land, and longer to cool down after.
In some ways, our climate is simply the result of redistributing all of that incoming heat away from the equator towards the north and south poles, through the air and ocean.

References
- https://www.climatechange.environment.nsw.gov.au/basics-climate-change/global-climate-system
- https://www.ipcc.ch/report/ar6/syr/resources/spm-headline-statements/
- http://www.bom.gov.au/climate/about/
About climate models
Climate models are our best tool for exploring plausible future climate scenarios.
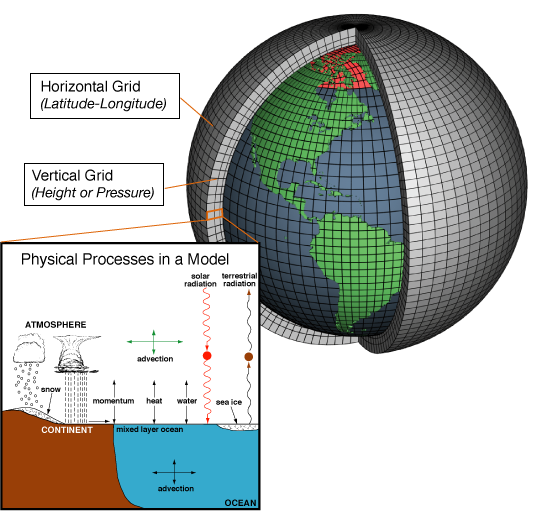
Also known as earth system models or general circulation models, they are built from many mathematical equations describing our understanding of the physical processes that underpin the global climate system – things like the movement of heat, energy and water between the atmosphere and the oceans, and from the equator to the poles.
They include the influence of the sun and greenhouse gases on the earth’s energy balance, which means we can test different greenhouse emissions scenarios to find out how the climate system will respond. The more we emit, the hotter and more extreme our climate system gets.

References
- https://www.climatechange.environment.nsw.gov.au/basics-climate-change/global-climate-system/climate-system-modelling
- https://www.climatechangeinaustralia.gov.au/en/learning-support/modelling-and-projections/
- http://www.bom.gov.au/climate/ahead/about/model/access.shtml
Forecasting future fire
For systems with a relatively simple link to the climate, like heatwaves, we can use output from climate models directly to explore how climate change will affect the number of dangerously hot days and nights under different emissions scenarios.
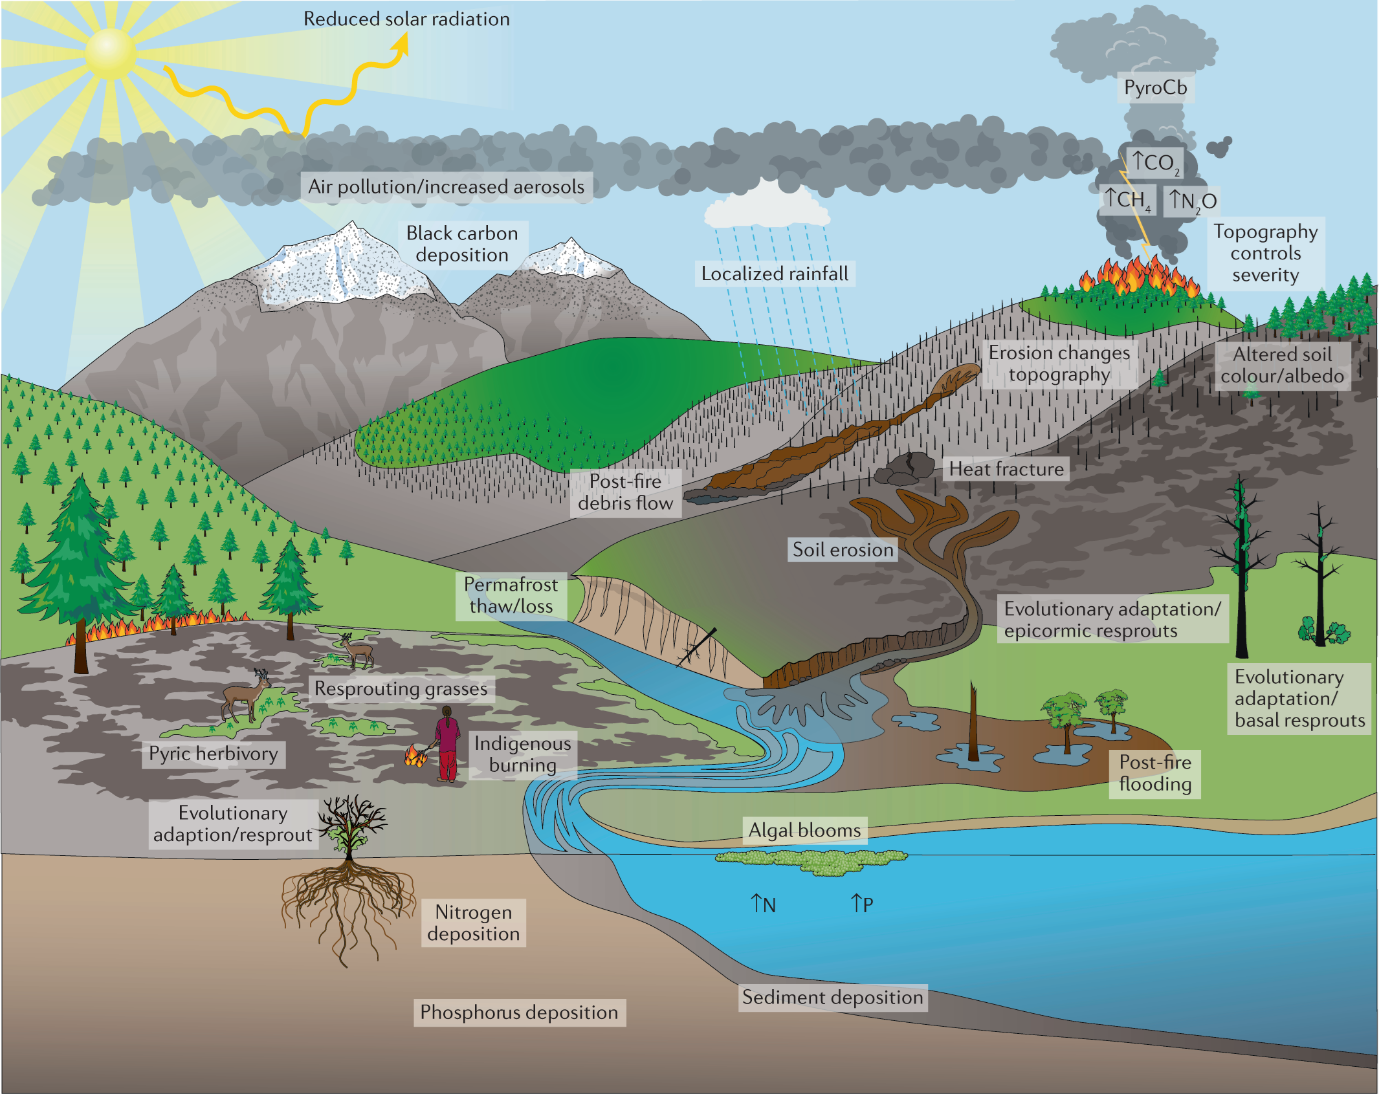
Fire is anything but simple. Climate affects fuel, duel dryness, weather and ignitions, often through multiple pathways! And of course, fire is affected by many other things like people and the things we do to prevent, prepare, respond and recover from fire.
This makes it hard to forecast future fire.
A common approach is to use climate models to project future fire weather conditions, and just assume that all of the other drivers of fire will not change. If possible, we should look at climate change effects on all of fire’s drivers. And we should consider how us humans might change too, for instance by clearing more land or planting more trees.
Even if we look at climate change impacts on all of fire’s drivers, there are still many other thorny issues waiting for us, like whether an increase or decrease in fire might change vegetation patterns, thereby changing the future risk of fire. These kind of feedback loops make forecasting future fire even harder.

References
- https://www.climatechange.vic.gov.au/victorias-changing-climate
- https://agupubs.onlinelibrary.wiley.com/doi/full/10.1029/2020RG000726
About this climate change data
The climate data shown here is based on projections from the ESCI climate change project. You can read more about the ESCI project here: https://www.climatechangeinaustralia.gov.au/en/projects/esci/about-esci/
Assessing the impact of climate change requires us to make decisions about what the future may look like. We do this by using several hazard scenarios to explore what is plausable. The ESCI project uses scenarios called ‘Representative Concentration Pathways’, or RCP’s to describe future greenhouse gas emmissions.
We’re showing two commonly used RCP’s:
- RCP8.5: a very high pathway. CO2 emissions grow, with ongoing high greenhouse gas emissions. This reprepresents at least 3–5 °C of global warming since pre-industrial times by 2100.
- RCP4.5: an intermediate pathway. CO2 emissions peak around 2040 then steady and decline. This represents at least 2–3 °C of global warming since pre-industrial times.
Under each scenario we look at 6 different models. These are combinations of 3 Global Climate Models (GCMs) and 2 Regional Climate Models (RCMs). We often take the mean of these models, known as the ‘ensemble mean’ as our best estimate of what is likely to happen.
If focus in on Victoria, the modelling shows that our future is likely to be hotter and dryer. The modelling also shows that our future is likely to be more variable, meaning bigger swings between extremes, more frequently. However, if we curb our greenhouse gas emissions, this will reduce the impact.
Maximum temperatures across Victoria are predicted to rise steadily. If we curb our greenhouse gas emissions (RCP4.5) we see maximum temperatures begin to plateau around 2060.
Precipitation across Victoria is predicted to gradually fall as temperatures increase. If greenhouse gas emissions continue to grow, we see it becoming dryer by 2100.
Relative humidity across Victoria is also predicted to gradually decline, as things get hotter and dryer. We see the effect of different RCP scenarios after 2080, but note that the range of the predictions also becomes wider.